Consumer Confidence Survey
- Japanese
- English
This survey is carried out every month to gain a quick understanding of shifts in consumer perception as a tool in evaluating economic trends.
Please see the"explanation" page of this survey for more details.
Summary of the latest survey
The Survey of August 2025 was released on August 29th, 2025 New
- This survey was conducted on August 15th, 2025.
- It covered 8,400 households (Households of two or more persons are 5,376,One-person households are 3,024).
- The response rate was 70.1% (Households of two or more persons: 70.7%, One-person households: 69.1%).
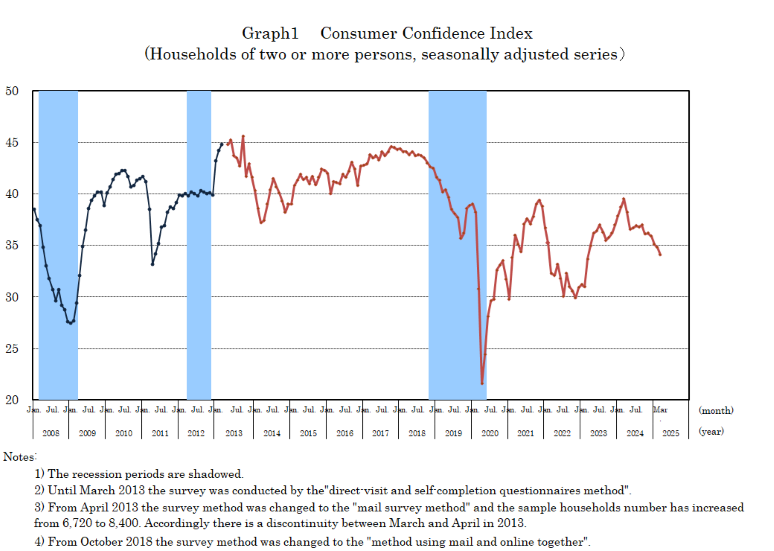
1. Consumer Confidence Index, Consumer Perception Indices
- The Consumer Confidence Index (seasonally adjusted series) in August 2025 was 34.9, up 1.2 points from the previous month.
- The categories of the Consumer Perception Indices (seasonally adjusted series), which are comprised of the Consumer Confidence Index in August are as follows;
Overall livelihood: 32.7 (up 1.3 from the previous month)
Income growth: 39.4 (up 0.9 from the previous month)
Employment: 39.3 (up 1.7 from the previous month)
Willingness to buy durable goods: 28.0 (up 0.6 from the previous month)
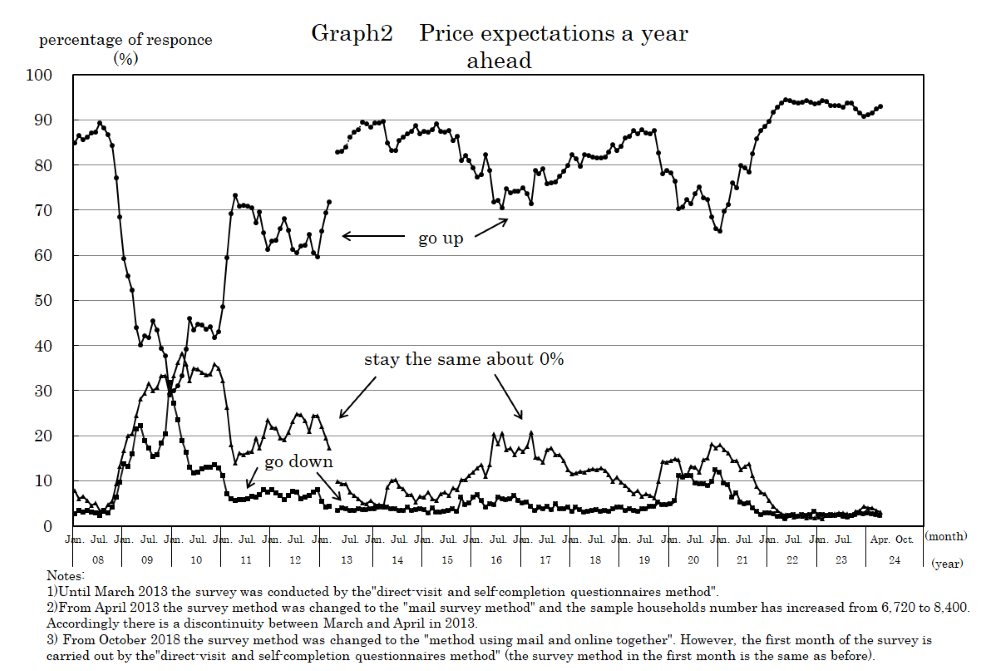
2. Price expectations a year ahead
- The percentage of a group who expect "Go up" in August was 93.4%, an increase of 1.0% points from the previous month.
- The percentage of a group who expect "Stay the same about 0%" in August was 2.9%, a decrease of 0.2% points from the previous month.
- The percentage of a group who expect "Go down" in August was 1.7%, a decrease of 0.8% points from the previous month.
Time series data
- The Development of the Consumer Confidence Index (Households of two or more persons, original series)(Excel:51KB)

- The Development of the Consumer Confidence Index (Households of two or more persons, seasonally adjusted series)(Excel:53KB)
- Price Expectations (Excel:126KB)
(Notes)
- The survey method was changed to the "method using mail and online together" from October 2018.
- The survey method was changed to the "mail survey method" from April 2013.
- At the same time, the released time-series tables were reviewed from April 2013. (The time-series data of Tokyo was scrapped.)
- The change of survey method from April 2013 has some impacts on the results of the survey.
- The results of April 2013 survey were compared to those of the examination survey * on March 2013.
* The examination survey was carried out from July 2012 to March 2013 via the mail survey method for the purpose of analysis of the impact on the results by the change of survey method.
- The summary and data of the examination survey
- 【reference】Connection method between the new series (from April 2013 survey)and the old one(until March 2013 survey)(added on 13 June,2013)