Monetary Valuation of Unpaid Work in 1996 -Japan-
May 21, 1998
Part revised: November 5, 1998
Department of National Accounts
Economic Research Institute
Economic Planning Agency
1. History
2. Background
3. Scope and method of monetary valuation of unpaid work
4. Estimation results
(1) Total assessed value of unpaid work
(2) Assessed value of unpaid work by activity type
(3) Assessed value of unpaid work by gender
(4) Assessed value of elderly/nursing care and child care
(5) Comparison of service production between unpaid work and industrial activities
(6) Comparison of unpaid work by region
(7) Comparison of assessed value of unpaid work with Britain
5. Issues to be noted
6. Base data
For further details, please contact:
Masahito Fukami
Senior Officer for Environmental Accounts
Address: Economic Planning Agency, 100-8970, Japan
Fax: 81-3-3581-0516
Email:masahito.fukami@epa.go.jp
1. History
The Economic Planning Agency published its "Monetary Valuation of Unpaid Work" on May 15, 1997, presenting the results of monetary valuation of unpaid work as of 1981, 1986, and 1991 in Japan.
This report presents the results of monetary valuation of unpaid work in 1996 using the same method as that of the previous valuations, based on the results of the "Survey on Time Use and Leisure Activities, 1996" published by the Statistics Bureau of the Management and Coordination Agency in September 1997.
2. Background
Daily life is supported not only by market economy activities but also by housework, including cooking and laundry, volunteer activities, and so forth. These activities can be considered unpaid work, because the worker offers such labor without requesting family members or others to compensate for the work done. In comparison, in case of a job or paid work, compensation is given for the labor offered on the market.
Unpaid work plays an important role in people's lives and has significant economic value. Economic statistics to date, however, have not adequately clarified or assessed the value of such work. The System of National Accounts (SNA) records all economic activities of one nation and publishes economic indices including gross domestic product (GDP). Nonetheless, unpaid work, which is not part of a market, is not recorded in SNA. Some Western nations are making efforts to assess the monetary value of unpaid work, which is comparable with that of market economic activities; they are also comparing factors such as, among others, GDP.
It is also worth clarifying the economic value of housework and its burden on women in a form that allows comparison with other economic indicators, because women have played a major role in such activities.
Against this background, the Department of National Accounts of the Economic Research Institute estimated the monetary value of unpaid work as of four points between 1981 to 1996 at five-year intervals, and conducted studies in 1997 and 1998.
In determining the scope of unpaid work, valuation methods, and the like, meetings of the Advisory Committee on Unpaid Work (chaired by Kimio Uno, Professor, Keio University) were held in 1996 to 1997, at which specialists gave advice.
We commissioned the Sumitomo Life-Research Institute, Inc. to perform calculations to estimate the value of unpaid work.
3. Scope and Method of Monetary Valuation of Unpaid Work
(1) Scope of unpaid work
"Unpaid work" as defined here as work in which the service provider and the service beneficiary are separable (i.e., the service can be provided by a third party) and the service can be provided in the market. This is referred to as "third criteria" and is used internationally.
Specifically, our estimate uses the following classification of unpaid work based on classifications used in the basic statistics (see Note 1).
Housework (cooking, cleaning, laundry, sewing and knitting, miscellaneous family affairs), elderly/nursing care, child care, shopping, and volunteer work (see Note 2).
(2) Method of monetary valuation
Since it is difficult to directly grasp and assess the value of services generated by housework, volunteer work, etc., the monetary value of unpaid work was estimated by using wages based upon the number of hours spent on such activities.
Value of unpaid work = per capita hours of unpaid work * hourly wage * population
Statistics used:
Hours of unpaid work - Results of survey on use of time on people age 15 and over included in the "Survey on Time Use and Leisure Activities," Management and Coordination Agency. Refer to Section 6 of this paper.
Hourly wage - Refer to the following and to Section 6 of this paper.
Population - "Survey on Time Use and Leisure Activities" (see Note 3)
Therefore, monetary valuation could largely differ depending upon the wage used. In this estimation, the monetary value of unpaid work was computed using three different types of wages in accordance with the following three concepts.
a. Opportunity cost method
b. Replacement cost method
b-1 Specialist approach
b-2 Generalist approach
a. Opportunity cost method (hereinafter referred to as the "OC method")
This method performs the valuation in terms of wages foregone (lost profit) as a result of opting not to offer services in the market. In this estimation, the average wages per time for respective sexes and age groups were used for valuation. One problem with this method is that the valuation varies according to who engaged in the unpaid work rather than the type of labor.
(Statistics used: "Basic Survey on Wage Structure," Ministry of Labor)
b. Replacement cost method
This method assesses unpaid work based upon the wage paid to a person who produces a similar service in the market.
b-1 Replacement cost method specialist approach (hereinafter referred to as the "RC-S method")
This method assesses unpaid work based upon wages paid to professionals (see Note 4) engaged in the production of similar services in the market.
It has been pointed out that this method is affected by a disparity in productivity between people engaged in unpaid work and professionals due to differences in economies of scale and in the capital equipment ratio.
(Statistics used: "Basic Survey on Wage Structure")
b-2 Replacement cost method generalist approach (hereinafter referred to as the "RC-G method")
This method assesses unpaid work based upon wages of household servants.
One problem pointed out with this method is that servants do not perform all unpaid work and that this method may not be appropriate for assessing volunteer work.
(Statistics used: "Survey of Wages of Home Workers," Clinical Nursing and Housekeeping Association of Japan)
Note 1)
Because the "Survey on Time Use and Leisure Activities" does not subdivide housework, hours used for respective types of housework have been calculated in the proportions given by the breakdown of "housework" (cooking, cleaning, laundry, sewing and knitting, miscellaneous family affairs) of the "National Time Use Surveys," NHK.
Note 2)
"Miscellaneous family affairs"
In the "National Time Use Survey," miscellaneous family affairs refer to types of housework other than cooking, cleaning, laundry, and sewing and knitting. Miscellaneous family affairs included in "housework" of "Survey on Time Use and Leisure Activities" are drying of bedding, care of family members, keeping of household accounts, affairs related to banks, city office, etc., car care, repair of furniture, etc.
"Elderly/nursing care"
In the "Survey on Time Use and Leisure Activities," elderly/nursing care are defined as "support given to a family member or a relative in another household for moving around during daily life, such as bathing, going to the toilet, moving around the house, taking meals, etc." They include among others, such activities for a family member who is temporarily in bed because of illness. Unpaid elderly care and nursing care for people other than family members are regarded as "volunteer work."
"Child care"
The "Survey on Time Use and Leisure Activities" defines child care as "changing of diapers for a baby or a small child, care of a baby or a small child, attending to children, help with children's homework, visiting a class in progress, keeping company during playtime, and watching school sports." It includes educational activities for children but taking care of school children falls under housework.
"Volunteer work"
The "Survey on Time Use and Leisure Activities" gives "cleaning of roads and parks in local communities, visiting facilities, procurement of relief goods for disaster-stricken areas, women's or youth activities, labor activities, political activities, religious activities, etc." as examples of volunteer work.
Note 3)
The population used has been obtained by adjusting the population in the "Survey on Time Use and Leisure Activities" with data in the "Monthly Report on Current Population Estimates" (Management and Coordination Agency).
Note 4)
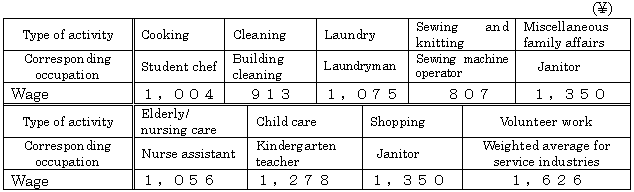
The occupations corresponding to respective types of unpaid work used under the replacement cost method specialist approach are shown in the table below.
Since "cooking" includes both preparation and cleaning up, "Student chef" has been chosen as the corresponding occupation, in consideration of the cooking skills of ordinary families.
The main jobs in "elderly care and nursing care" are bedmaking, taking temperature, and preparation of meals. Since such activities are ancillary to medical treatment, "nurse assistant" was selected as the corresponding occupation.
Since there is no occupation that corresponds to "volunteer work," the weighted average of wages in the "personal service industry," "cooperatives," "social insurance and social welfare," and "political, economic and cultural institutions" was used.
Occupations Corresponding to Respective Types of Unpaid Work
| Type of activity | Corresponding occupation |
| Cooking | Student chef |
| Cleaning | Building cleaning |
| Laundry | Laundryman |
| Sewing and knitting | Sewing machine operator |
| Miscellaneous family affairs | Janitor |
| Shopping | Janitor |
| Child care | Kindergarten teacher |
| Elderly/nursing care | Nurse assistant |
| Volunteer work | Weighted average for service industries |
4. Estimation Results
(1) Total assessed value of unpaid work
In 1996, the total assessed value of unpaid work in Japan amounted to around 76 trillion yen to 116 trillion yen, accounting for about 15% to 23% of GDP. The ratio to GDP in 1996 was slightly higher than that in previous years.
The assessed value of unpaid work is the result of the assessment of the value of work. Compared with salaries and wages, which are distributions of GDP to workers and can be regarded as the assessed value of paid work, the assessed value of unpaid work was around 32% to 49% of that of paid work.
Comparison of hours spent on unpaid and paid work showed that the number of hours spent on unpaid work stands at about 50% of the number of hours spent on paid work.
Table 1: Total Assessed Value of Unpaid Work and Percentage of GDP
( billion yen, % )
| GDP | OC | RC-S | RC-G | ||||
| Total | Percentage of GDP | Total | Percentage of GDP | Total | Percentage of GDP | ||
| 1981 | 257,962.9 | 53,264 | 20.6 | 48,538 | 18.8 | 37,339 | 14.5 |
| 1986 | 335,457.2 | 71,828 | 21.4 | 62,857 | 18.7 | 49,037 | 14.6 |
| 1991 | 458,299.1 | 98,858 | 21.6 | 84,027 | 18.3 | 66,728 | 14.6 |
| 1996 | 499,861.0 | 116,115 | 23.2 | 99,776 | 20.0 | 76,069 | 15.2 |
Table 2: Total Assessed Value of Unpaid Work and Percentage of Salaries and Wages
( billion yen, % )
| Salary and wages | Assessed value as a percentage of salary and wages |
(Reference) Comparison of working hours (per capita/day) |
|||||
| OC | RC-S | RC-G | Hours of unpaid work | Hours of paid work | Unpaid work/paid work | ||
| 1981 | 124,186.0 | 42.9 | 39.1 | 30.1 | 2H12 | 4H35 | 48.0 |
| 1986 | 157,112.7 | 45.7 | 40.0 | 31.2 | 2H15 | 4H27 | 50.6 |
| 1991 | 212,337.6 | 46.6 | 39.6 | 31.4 | 2H16 | 4H20 | 52.3 |
| 1996 | 239,377.8 | 48.5 | 41.7 | 31.8 | 2H13 | 4H10 | 53.2 |
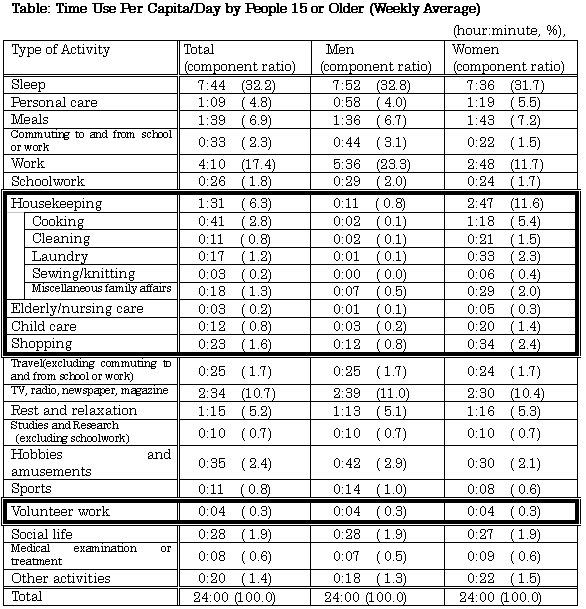
(Note) Data on the number of working hours represent the weekly averages per capita per day, that have been calculated using total average number of hours (whole week) worked by workers age 15 or over by activity type, which are shown in the "Survey on Time Use and Leisure Activities." People not engaged in a relevant activity are also included in the calculation of averages.
The "number of hours of paid work" is the number of hours of "work" in the above-mentioned survey. This applies elsewhere in this report.
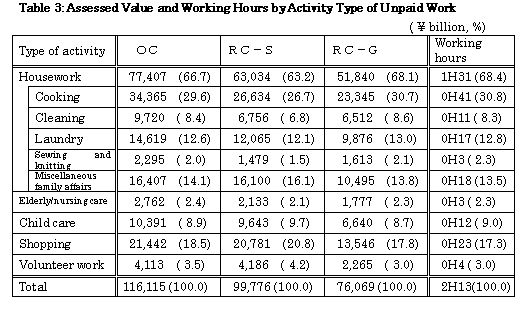
(2) Assessed value of unpaid work by activity type
An analysis of assessed value of unpaid work by activity type in 1996 shows that the assessed value of cooking, a sub-section of housework, is the largest at 23 trillion yen to 34 trillion yen, accounting for about 27% to 31% of the total assessed value. This reflects the large number of working hours.
Cooking is followed by shopping, miscellaneous family affairs, and laundry. The assessed value of unpaid work that everyone needs to perform in their daily life is higher.
In contrast, proportions of elderly and nursing care and child care to the total assessed value are low, because there are people who need to offer such services and those who do not. Nevertheless, such proportions will be higher for people who need to be engaged in such work (refer to "(4) Assessed value of unpaid nursing care and child care").
The assessed value of volunteer work is about 2 trillion yen to 4 trillion yen, accounting for only a small portion in the total assessed value of unpaid work. Its percentage of GDP is less than 1%.
(3) Assessed value of unpaid work by gender
1.Breakdown by gender of total assessed value of unpaid work
An analysis of the total assessed value of unpaid work by gender in 1996 shows that women account for around 85% to 89% of the total, proving that the majority of unpaid work is done by women. Nevertheless, a year-to-year comparison reveals that the ratio of men is gradually rising.
Table 4: Breakdown of Total Assessed Value of Unpaid Work by Gender
( billion yen, %)
| OC | RC-S | RC-G | ||||
| Men | Women (component ratio) | Men | Women (component ratio) | Men | Women (component ratio) | |
| 1981 | 5,082 | 48,182 (90.5) | 3,465 | 45,073 (92.9) | 2,395 | 34,945 (93.6) |
| 1986 | 8,150 | 63,678 (88.7) | 5,373 | 57,485 (91.5) | 3,844 | 45,192 (92.2) |
| 1991 | 14,528 | 84,330 (85.3) | 9,724 | 74,303 (88.4) | 7,044 | 59,684 (89.4) |
| 1996 | 18,011 | 98,104 (84.5) | 13,016 | 86,761 (87.0) | 8,673 | 67,396 (88.6) |
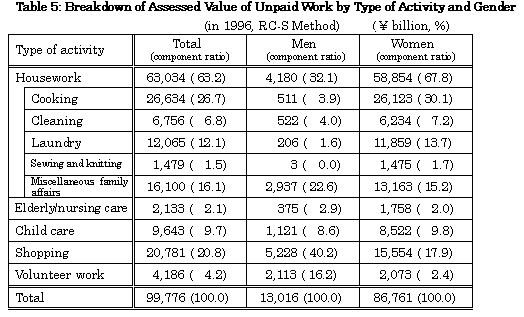
2.Breakdown of assessed value of unpaid work by type of activity and gender
An analysis of the assessed value of unpaid work by type of activity and gender under the RC-S method shows that for women in 1996, housework accounts for nearly 70% of all the unpaid work. Cooking, in particular, accounts for around 30% of the total.
On the other hand, for men, housework accounts for about 32% of the total, with cooking accounting for less than 4%. Shopping accounts for the largest share of about 40%.
3.Annual assessed value of unpaid work per capita by gender
An analysis by gender of per capita assessed value of unpaid work in 1996 shows that the assessed value for women is 5 to 7 times larger than that for men. Using the OC method that gives the highest assessment, per capita assessed value of unpaid work done by men is around 0.35 million yen, compared with the equivalent value for women of around 1.8 million yen.
Nonetheless, a year-to-year comparison reveals that the difference between men and women is gradually becoming smaller.
An analysis by gender of the total of assessed value of unpaid work (OC method) and market wages, which can be regarded as the annual assessed value of all types of work, shows that the figure for men is slightly higher. Nonetheless, total hours spent on paid and unpaid work (total working hours) are longer in women.
Table 6: Annual Per Capita Assessed Value of Unpaid Work by Gender
(10 thousand yen)
| OC | RC-S | RC-G | ||||
| Men | Women | Men | Women | Men | Women | |
| 1981 | 11.6 | 103.8 | 7.9 | 97.1 | 5.5 | 75.3 |
| 1986 | 17.4 | 128.7 | 11.5 | 116.2 | 8.2 | 91.4 |
| 1991 | 29.2 | 160.7 | 19.6 | 141.6 | 14.2 | 113.8 |
| 1996 | 34.9 | 179.8 | 25.2 | 159.0 | 16.8 | 123.5 |
| Women/Men (1996) | 5.2 | 6.3 | 7.4 | |||
(Reference) Market Wage, Total of Market Wage and Assessed Value of Unpaid Work
(OC method) (10 thousand yen)
| Market wage | Total | |||
| Men | Women | Men | Women | |
| 1981 | 282.4 | 156.6 | 294.0 | 260.4 |
| 1986 | 337.0 | 190.7 | 354.4 | 319.4 |
| 1991 | 408.7 | 234.8 | 437.9 | 395.5 |
| 1996 | 439.3 | 265.6 | 474.2 | 445.4 |
(Reference) Working Hours per Day
| Unpaid work | Paid work | Total working hours | ||||
| Men | Women | Men | Women | Men | Women | |
| 1981 | 0H17 | 4H1 | 6H4 | 3H11 | 6H21 | 7H12 |
| 1986 | 0H22 | 4H2 | 5H58 | 3H2 | 6H20 | 7H4 |
| 1991 | 0H30 | 3H57 | 5H46 | 2H59 | 6H16 | 6H56 |
| 1996 | 0H31 | 3H50 | 5H36 | 2H48 | 6H7 | 6H38 |
4.Comparison of annual per capita assessed value by gender and attribute
An analysis of the annual per capita assessed value of unpaid work for men and women by attribute shows that the value for married, jobless women (full-time housewives) is the highest at an average of 3,039,000 yen. Women aged 30 to 34 showed the highest value of 4,104,000 yen.
On the other hand, the average of per capita assessed value of unpaid work for married working women reached 1,993,000 yen, representing over 5 times the value for married, working men. This reflects the heavy burden of unpaid work on married, working women.
The sum of the above figure and the average market wage for women, which represents the annual total of assessed value of work done by working, married women, stands at 4,649,000 yen.
It should be also noted that under the OC method, which was used for this estimation, the assessed value for women tends to be lower because the assessed value for men becomes relatively high, reflecting a disparity in wages between men and women.
Table 7: Comparison of Annual Per Capita Assessed Value by Gender and Attribute
(in 1996, OC method) (10 thousand yen)
| Average | 15-19 years old | 20-24 years old | 25-29 years old | 30-34 years old | 35-39 years old | |||
|
Women |
Married | Working | 199.3 | 54.8 | 132.9 | 183.3 | 244.8 | 243.2 |
| Jobless | 303.9 | 212.6 | 283.7 | 355.2 | 410.4 | 409.6 | ||
| Not married | 76.5 | 18.5 | 35.8 | 54.7 | 86.1 | 107.2 | ||
| Men | Married | Working | 36.6 | 14.4 | 30.5 | 33.3 | 41.4 | 45.3 |
| Jobless | 68.4 | 0.0 | 86.2 | 29.6 | 69.9 | 96.9 | ||
| Not married | 23.9 | 9.2 | 14.5 | 17.3 | 23.9 | 28.8 | ||
| 40-44 years old | 45-49 years old | 50-54 years old | 55-59 years old | 60-64 years old | 65-69 years old | |||
| Women | Married | Working | 226.9 | 206.7 | 186.4 | 170.3 | 152.3 | 151.7 |
| Jobless | 369.8 | 331.0 | 316.6 | 280.1 | 244.7 | 232.0 | ||
| Not married | 125.6 | 130.1 | 135.3 | 138.1 | 148.4 | 152.3 | ||
| Men | Married | Working | 40.9 | 34.6 | 35.7 | 33.6 | 30.7 | 31.4 |
| Jobless | 85.0 | 69.4 | 68.3 | 100.4 | 86.1 | 72.0 | ||
| Not married | 37.2 | 50.1 | 66.0 | 77.7 | 89.3 | 77.7 | ||
(4) Assessed value of unpaid elderly/nursing care and child care
It has been pointed out that Japan will face a significant decrease in the number of children born in the country, which will be coupled with the general aging of the society. Accordingly, elderly/nursing care and child care, which are largely performed without pay, are likely to become even more of a social problem.
In light of the above, we conducted a detailed monetary valuation of unpaid elderly/nursing care and child care. In this estimation, a simplified RC-S method was used for convenience. It assesses the monetary value of housework based upon the average wage for the corresponding profession.
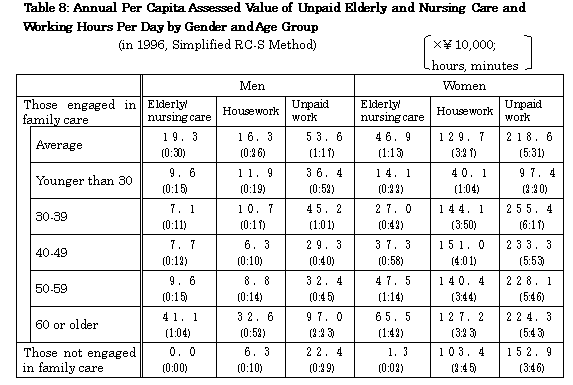
1.Assessed value of elderly and nursing care for those engaged in family care
People were classified into those engaged in family care and those who are not, according to whether or not they usually take care of their family. The assessed value of elderly and nursing care was then analyzed by gender and age group.
As for those engaged in family care, such care accounts for a considerable portion of total assessed value of unpaid work, representing 36% for men and 21.5% for women on average. In addition, total assessed value of unpaid work for those engaged in family care is significantly higher than the equivalent figure for those who are not.
An analysis by gender shows that the value for women is larger than the equivalent for men, but the difference is smaller than that in housework.
An analysis by age group shows that in women, the assessed value becomes higher as they get older from their thirties. In case of men, however, the value becomes suddenly higher when they reach their sixties.
2.Assessed value of child care for married couples
Married couples with children (living separately from grandparents) were classified into dual-income families and those with jobless wives, for analysis of assessed value of child care for married couples.
A comparison between dual-income families and those with a jobless wife shows that the assessed value of unpaid work for dual-income families is around 60% of that for those with a jobless wife. In particular, the assessed value of child care in dual-income families is significantly lower, representing around 22% of the figure for those with a jobless wife.
It is assumed that dual-income families are increasingly consigning unpaid work, mainly child care, to external parties such as a day-care center. At the same time, it is also possible that wives tend to leave their jobs when they have infants or small children who need maximum care and the families cease to be dual-income.
Table 9 shows the working hours of paid and unpaid work of husbands and wives by family type.
Table 9: Annual Per Capita Assessed Value of Unpaid Child Care and Per Day Working Hours by Family Type
(in 1996, Simplified RC-S Method)
ten thousand yen; hours, minutes
| Child care | Housework | Unpaid work | Paid work | Total working hours | ||
| Dual-income families | Husbands | 1.3 (0:03) |
4.4 (0:07) |
18.7 (0:24) |
(7:26) |
(7:50) |
| Wives | 14.8 (0:19) |
134.7 (3:35) |
184.9 (4:37) |
(4:30) |
(9:07) |
|
| Total | 17.1 (0:22) |
139.1 (3:42) |
203.6 (5:01) |
(11:56) |
(16:57) |
|
| Families with a jobless wife | Husbands | 6.2 (0:08) |
2.1 (0:05) |
23.6 (0:30) |
(7:12) | (7:42) |
| Wives | 70.0 (1:30) |
189.2 (5:02) |
312.9 (7:37) |
(0:03) | 7:40) | |
| Total | 76.2 (1:38) |
192.4 (5:07) |
336.5 (8:07) |
(7:15) | (15:22) | |
(5) Comparison of service production between unpaid work and industrial activities.
We tried to compare the amount of service produced by unpaid work in households and the amount of service offered to households by industrial and other activities.
In this comparison, the monetary value of unpaid work is considered equivalent to wages and salaries that constitute part of the output value of service and other industries (see Note). Accordingly, the proportion of output value to salaries and wages in the industry producing a similar type of service as that produced by the relevant unpaid work was used to calculate the service output value of the unpaid work based upon its assessed value. In doing so, a disparity in productivity between unpaid work and industrial activities was ignored.
According to our estimate, households produce 6.2 times more than the "food service industry" in "cooking" and 30 times more than the "laundry industry" in "laundry." As for "elderly/nursing and child care," households produce 6.3 times more than "nonprofit institutions." This proves the significant economic value of unpaid work and important roles played by unpaid work in daily life.
(Note)
Output value of service industries = interim consumption + wages and salaries + employers'contributions to social security and other schemes in respect to their employees + consumption of fixed capital + net indirect taxes + operating surplus
Table 10: Comparison of Assessed Value of Service Produced by Unpaid Work with Output Value of Service Industries (in 1996, RC-S method)
-
Cooking and food service industry
( billion yen)
| Cooking | Food service industry | Cooking/Food service industry | |
| Assessed value of unpaid work | 26,634 | - | - |
| Service output value | 96,764 | 15,237 | 6.2 |
(Note 1) The food service industry includes restaurants, coffee shops, and amusement restaurants.
(Note 2) Service output value of cooking = Assessed value of unpaid work *3.558 (output value of food service industry/wages and salaries in the same industry). The base data have been quoted from the input-output tables for 1990.
(Note 3) The assessed service output value for the food service industry means the amount finally consumed by households, out of the output value of the same industry.
2."Laundry" and "laundry industry"
( billion yen)
| Laundry | Laundry industry | Laundry/laundry industry | |
| Assessed value of unpaid work | 12,065 | - | - |
| Service output value | 34,458 | 1,143 | 30 |
(Note 1) Service output value of laundry = Assessed value of unpaid work *2.856 (output value of laundry industryyenwages and salaries of the same industry). The base data have been quoted from the input-output tables for 1990.
(Note 2) The service output value of the laundry industry shows the value finally consumed by households, out of the output value of the same industry.
3."Child care and elderly/nursing care" and "day-care and senior citizens welfare institutions, etc."
( billion yen)
| Child care and elderly/nursing care | Day-care and senior citizens welfare institutions, etc. | Child care, etc./welfare institutions, etc. | |
| Assessed value of unpaid work | 11,776 | - | - |
| Service output value | 19,925 | 3,185 | 6.3 |
(Note 1) Day-care and senior citizens welfare institutions, etc. consist of the child welfare business, elderly welfare business, mentally handicapped and physically disabled welfare business, rehabilitation care business, and other social insurance and social welfare mentioned in the "Private Nonprofit Institutions Income and Expenditure Survey 1996," Economic Planning Agency.
(Note 2) Service output value for child care and elderly/nursing care = Assessed value of unpaid work *1.692 (output value of day-care and senior citizens welfare institutions, etc./wages and salaries in day-care and senior citizens welfare institutions, etc.). The base data have been quoted from "Private Nonprofit Institutions Income and Expenditure Survey 1996."
(6) Comparison of unpaid work by region
The annual per capita assessed value of unpaid work was calculated for each region (under the OC method, data on hours and wages used are both prefectural data). The value obtained was compared with the per capita compensation of employees in the relevant region.
The annual assessed value is the highest in the Kinki region, while the percentage of compensation of employees is also the highest in the region. This suggests that people in the region spend many hours on unpaid work while the wage standard is also high.
On the other hand, in the Hokkaido and Tohoku regions, where people spend fewer hours on unpaid work, the annual assessed value of unpaid work and the percentage of compensation of employees are the lowest. The time spent on paid work in the region, however, is the longest, a distinction those regions share with the Tokai and Hokuriku regions.
Table 11: Comparison by Region of Annual Per Capita Assessed Value of Unpaid Work and Compensation of Employees ( in 1996, OC method)
(thousand yen)
| Annual assessed value of unpaid work | Compensation of employees (in FY1995) | Percentage of compensation of employees | (Reference)
Working hours (per capita/day) |
||
| Unpaid work | Paid work | ||||
| Hokkaido & Tohoku | 881 | 4,344 | 20.3 | 2H6 | 4H24 |
| Kanto & Koshin | 1,261 | 5,661 | 22.3 | 2H13 | 4H13 |
| Tokai & Hokuriku | 1,050 | 4,730 | 22.2 | 2H13 | 4H24 |
| Kinki | 1,273 | 5,436 | 23.4 | 2H23 | 4H1 |
| Chugoku | 1,030 | 4,805 | 21.4 | 2H16 | 4H14 |
| Shikoku | 951 | 4,640 | 20.5 | 2H12 | 4H11 |
| Kyushu & Okinawa | 952 | 4,455 | 21.4 | 2H12 | 4H8 |
| Entire country | 1,094 | 5,089 | 21.5 | 2H13 | 4H10 |
(Note) Compensation of employees consists of "salaries and wages," "employers" contributions to social security schemes, etc. in respect of their employees." Figures for fiscal 1995 "("Prefectural Accounts 1995," Economic Planning Agency) were used, since figures for 1996 were not available.
The working hours for respective regions represent the simple average of the figures for respective prefectures included in the relevant region.
(Breakdown of regions)
Hokkaido & Tohoku: Hokkaido, Aomori, Iwate, Miyagi, Akita, Yamagata, Fukushima, Niigata
Kanto & Koshin: Ibaraki, Tochigi, Gunma, Saitama, Chiba, Tokyo, Kanagawa, Yamanashi, Nagano
Tokai & Hokuriku: Shizuoka, Toyama, Ishikawa, Gifu, Aichi, Mie, Fukui
Kinki: Shiga, Kyoto, Osaka, Hyogo, Nara, Wakayama
Chugoku: Tottori, Shimane, Okayama, Hiroshima, Yamaguchi
Shikoku: Tokushima, Kagawa, Ehime, Kochi
Kyushu & Okinawa: Fukuoka, Saga, Nagasaki, Kumamoto, Oita, Miyazaki, Kagoshima, Okinawa
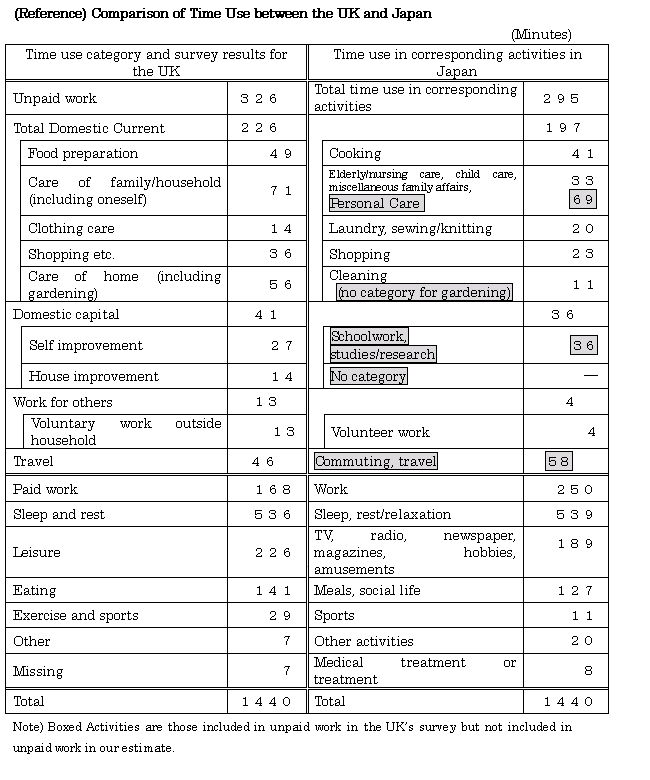
However, "unpaid work valued as paid by gender" takes the ratio of paid work to unpaid work separately for men and women and applies the gender specific average pay rates to each. "Valued pay rate for domestic work" and "valued pay rate for industry" apply pay rates more disaggregated by industry and maintain the disaggregation by gender.
Moreover, the scope of unpaid work in the UK is significantly larger than that in Japan. So it is difficult to directly compare the figures of time use in the two nations (see the following reference table).
Therefore, applying the UK's method to Japan after making the scope of unpaid work in Japan as much as close as possible to that in the UK, the total assessed value of unpaid work in Japan is estimated below:
Japan (1996)
time for unpaid work 295 (minutes) / time for paid work 250 (minutes) = 1.18
Total wages and salaries = 239,377.8 billion yen
The total assessed value of unpaid work = 282,465.8 billion yen
62% of GDP (at current factor cost)
There are two main reasons for the significant difference of the percentage of GDP between the two nations. One is that the scope of unpaid work in the UK is larger than that in Japan, even after adjustments. The other is that the ratios of unpaid/paid hours are quite different because the paid working hours are longer in Japan than in the UK. Moreover, the GDP ratio of the wages and salaries is 55% in the UK and 52% in Japan, a factor that has influenced the results slightly.
Acknowledgements
We would like to acknowledge the help of Mr. Uzair Rizki (Office for National Statistics of the UK) who gave us detailed information about the methods used for monetary valuation of unpaid work in the UK and offered useful commentary on an earlier draft.
5. Issues to be Noted
Attention needs to be paid to the following issues when making use of our estimates.
(1) Significance of non-economic value
Unpaid work could frequently have special value or effects for the provider and the beneficiary, because such activities are unpaid and devoted. For example, child care is a form of expression of love by parents for their children, and contributes to the formation of bonds between parents and children. In that sense, unpaid work has, in some cases, non-economic value rather than economic value, in the form of provision of a type of service.
Our estimate does not attempt to assess such non-economic value. Monetary valuation under the OC method can be regarded as an estimate that considers subjective valuation by the provider, because the provider chose to spend valuable time on unpaid work. The method, however, does not attempt to value or estimate respect or appreciation by the beneficiary for the unpaid work or effects of housework on the formation of bonds among family members.
(2) Problems with the scope of unpaid work
The scope of unpaid work is fixed basically in accordance with third-party criteria. Some people, however, argue that the scope should be slightly widened. For example, according to some, "schoolwork" and "studies and researches" should be included in unpaid work, because such activities have some labor elements in that they are conducted in order to improve the potential ability to gain income in the future.
On the other hand, some overseas estimates include "Travel" for unpaid work in unpaid work, regarding it as ancillary to unpaid work. Our estimate, however, excluded travel as a whole from unpaid work, as the statistics used did not specify the reasons for the travel, with the exception of commuting.
(3) Limitation of time use survey data
Our estimate is based on the results of the distribution of time use by people, as given in the "Survey on Time Use and Leisure Activities" conducted every five years by the Management and Coordination Agency. With regard to the monetary valuation of unpaid work, the survey has several limitations, in addition to problems in the handling of "travel," since the purpose of the survey is not to clarify the conditions of unpaid work.
One such limitation is that because the "Survey on Time Use and Leisure Activities" does not have categories for some of the activities that are theoretically unpaid work, it is impossible to assess the monetary value of such activities under an independent classification. For example, house maintenance and gardening are regarded as unpaid work and are included in equivalent surveys in other nations. In the "Survey on Time Use and Leisure Activities," however, such activities are included in "housework" or "hobbies and amusements," resulting in possible underestimation of unpaid work compared with other nations. Our estimate gives a breakdown of housework. The "Survey on Time Use and Leisure Activities," however, does not have such a breakdown; therefore, our estimate referred to the "National Time Use Survey" conducted by NHK in this regard. As a result, the assessed value for each sub-section of "housework" is not necessarily accurate.
Furthermore, people often engage in two types of unpaid work at the same time. Mothers, for example, do housework while taking care of their children. Therefore, it is desirable to assess such activities in a precise manner, and some of the surveys conducted abroad double-count such activities. The "Survey on Time Use and Leisure Activities," however, covers only main activities, and accordingly, our estimate evaluates only the main activities.
(4) Problems with applied wage
The OC method uses the average wages for respective genders and age groups. As a result, a disparity in wages between men and women is directly reflected in the assessed monetary value of unpaid work by sex. Because of this, although time spent by women on unpaid work is longer than that spent by men, the difference in the assessed value becomes smaller, or the assessed value for men could turn out to be larger than that for women, because the applied wage for men is higher than that for women. The burden of unpaid work by sex can be more simply revealed by time use data.
On the other hand, there are some arguments on corresponding occupations used under the Replacement Cost Method Specialist Approach (RC-S method). Since it is difficult to agree on a single correspondence, we chose occupations on which statistics were available. In addition, wages of occupations or housework employees used under the RC method are lower than those of other types of jobs. Consequently, assessed value under the RC method tends to be lower than that obtained under the OC method.
(5) Problems with output valuation
In our estimate, the monetary value of unpaid work is obtained by multiplying hours by wage. Because of this, monetary value is high if working hours are long or the applied wage is high, regardless of the quantity and quality of the service actually provided by the relevant unpaid work.
The value of service in a market economy should essentially be evaluated by the market price based upon the quantity and quality of the service. In view of this, in the field of monetary valuation of unpaid work, efforts are being made to develop a method to assess the value of the service itself (or output) produced by the relevant unpaid work.
With regard to output valuation, some theoretical achievements have been reported abroad, but no method has been established yet. Besides, a considerable amount of base data is necessary for such valuation, a problem that must be addressed in the future.
6. Base Data
The outlines of time and wage data that constituted the base for monetary valuation of unpaid work in 1996 are shown below.
(1) Time data
The base data are the results of a survey on time use published in the "Survey on Time Use and Leisure Activities 1996." Data for sub-sections of "housework" have been calculated by dividing the total hours used for "housework" in the proportion (see Note) that is given in the "National Time Use Survey 1990" (NHK).
When the provider is engaged in two or more different types of work at the same time, the hours spent are recorded as those spent on the main activity.
(Note) The proportion of time spent on each type of housework has been adjusted in accordance with the survey by NHK in 1995 (aftercode system), to estimate such a proportion in 1996.
(2) Wage data
1.OC method
The base data used were wages per hour by gender and age group, which were obtained by dividing the prescribed wages in respective genders and age groups by the prescribed actual working hours in the relevant category shown in "Basic Survey on Wage Structure 1996."
The average wage for all workers calculated by the same method is 1,749 yen, while the average for men is 1,976 yen and that for women is 1,255 yen.
(yen)
| Age | Men | Women |
|
15-19 |
957 |
894 |
|
20-24 |
1,174 |
1,083 |
|
25-29 |
1,464 |
1,270 |
|
30-34 |
1,784 |
1,376 |
|
35-39 |
2,057 |
1,418 |
|
40-44 |
2,272 |
1,369 |
|
45-49 |
2,450 |
1,342 |
|
50-54 |
2,543 |
1,327 |
|
55-59 |
2,311 |
1,253 |
|
60-64 |
1,742 |
1,167 |
|
65- |
1,568 |
1,169 |
2.RC-S method
The base data used were wages per hour by occupation type, which were obtained by dividing the prescribed wages in respective occupation types by the prescribed actual working hours in the relevant category shown in "Basic Survey on Wage Structure 1996."
On the other hand, under the simplified RC-S method, the average wage for the corresponding occupation (1,030 yen) was applied to housework (cooking, cleaning, laundry, sewing and knitting, and miscellaneous family affairs). As for other activities, wages that were applied under the RC-S method were also used under the simplified RC-S method.
3.RC-G method
The national average wage (880 yen) was calculated from wages paid for housework support service by region, which are shown in the "Survey of Wages of Home Workers FY1996," and was used as base data.